3.2.1 CardinalSymptoms
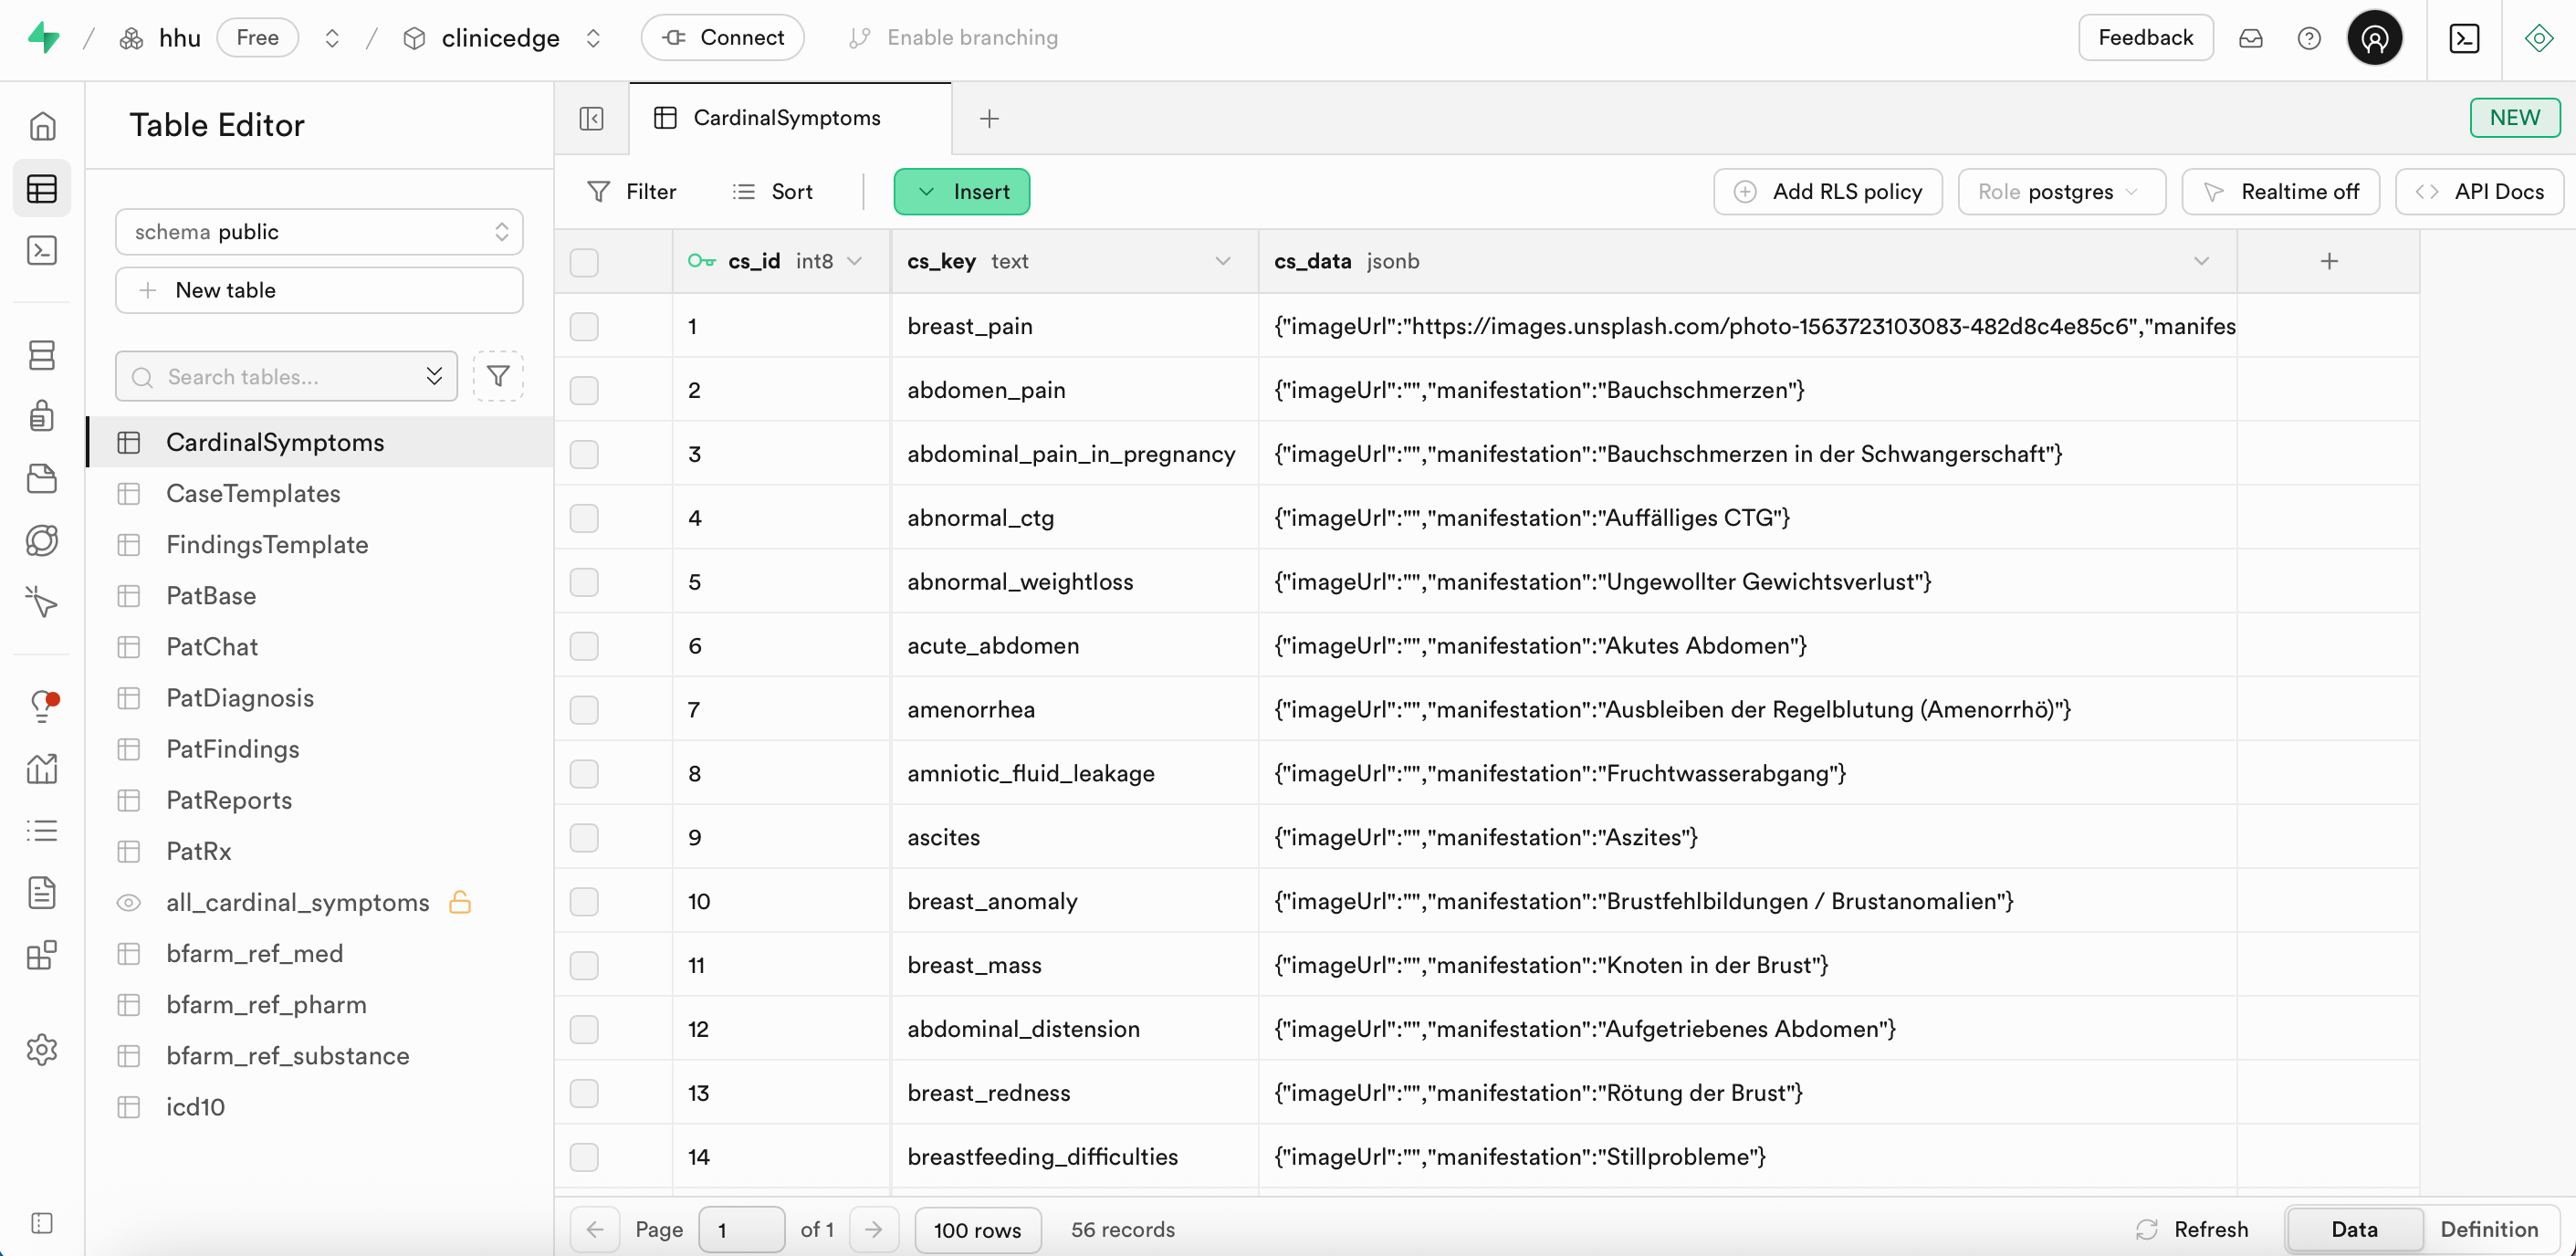
The CardinalSymptoms table in Supabase defines a reference list of common cardinal symptoms in gynecological and obstetrics diagnoses. It serves as a symptom dictionary that allows diagnoses to be grouped based on shared clinical manifestations.
These cardinal symptoms are displayed on the Clinic Edge landing page, where users can select a symptom to receive a randomly generated patient case linked to that symptom.
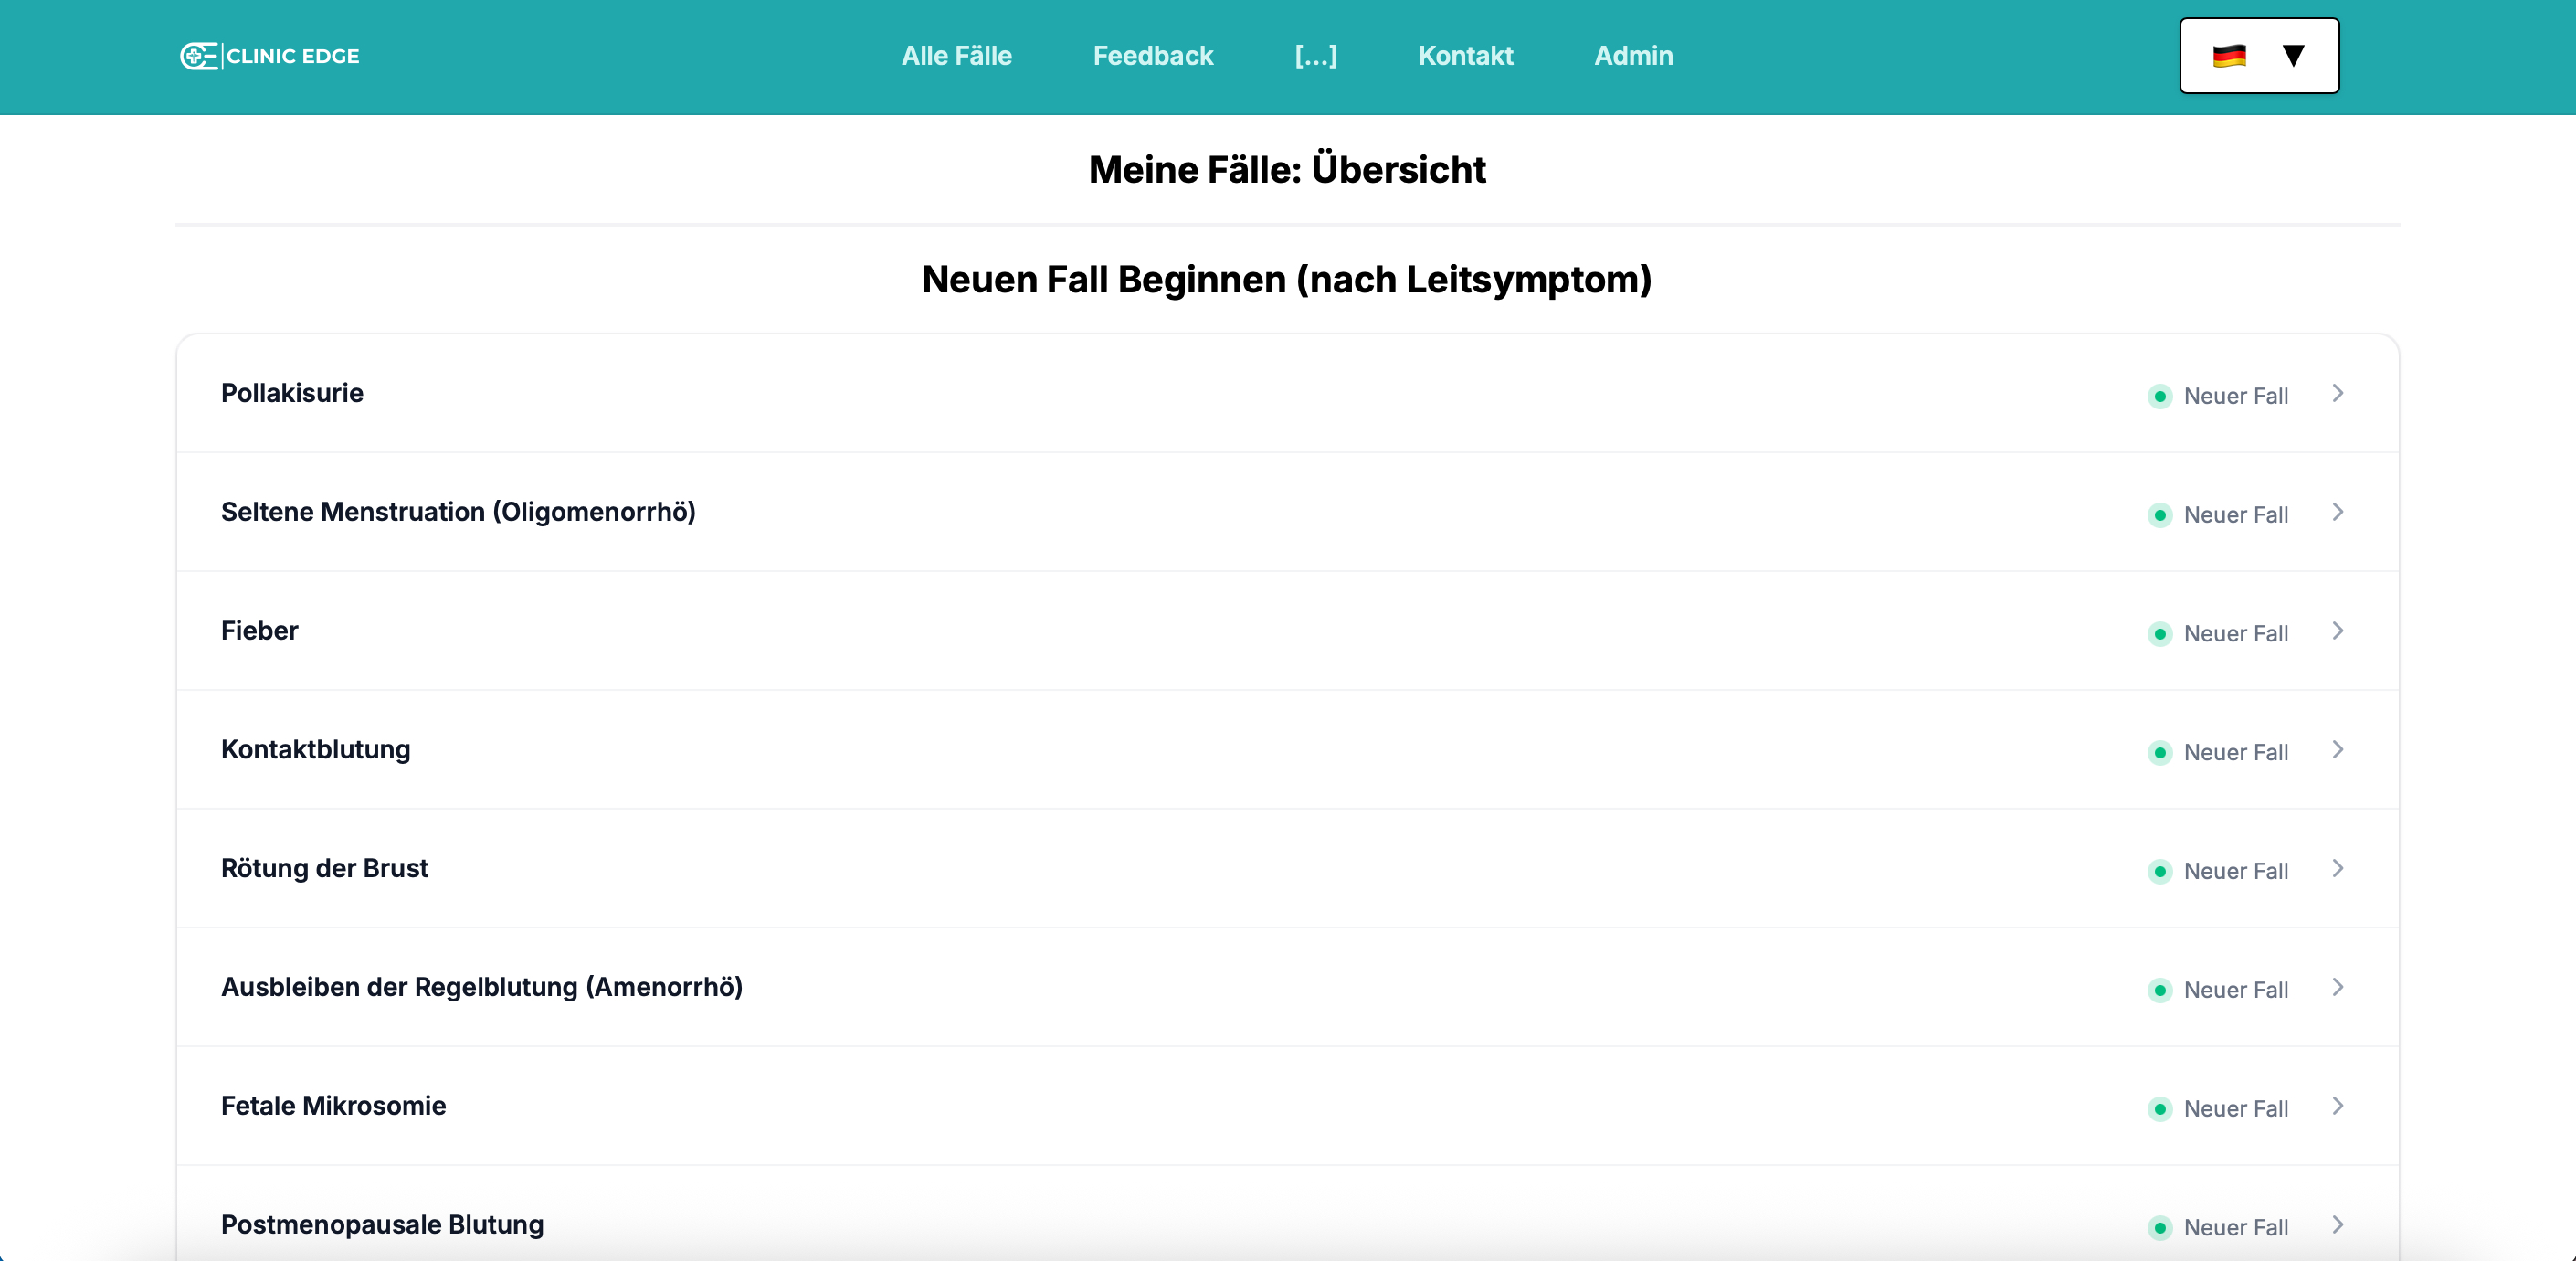
Table Structure
The Clinic Edge landing page is built upon the CardinalSymptoms table in Supabase, which stores the underlying data to display the list of symptoms. This table stores metadata for each cardinal symptom, including a display title (manifestation) and an optional image, both defined in the cs_data JSON field.
The structure of the table is as follows:
| Column | Format | Type | Description |
|---|---|---|---|
cs_id | bigint | number | Internal ID for each cardinal symptom |
cs_key | text | string | Identifier for each cardinal symptom (e.g., "breast_pain") |
cs_data | jsonb | json | JSON object containing display metadata, such as title and optional image |
Integration with CaseTemplates
Each case in Clinic Edge is defined as a JSON object located in the CaseTemplates table in Supabase. For each case, cardinal symptoms are defined in the cardinal_symptoms array inside their case_data. This allows each symptom to be associated with multiple diagnoses and vice versa.
For example, a case like adnexitis can be linked to a set of cardinal symptoms (e.g., abdominal pain, fever), while the same cardinal symptoms also appear across other diagnoses.
Example from the case_data for adnexitis:
"cardinal_symptoms": [
    "abdominal_pain",
    "fever",
    "acute_abdomen",
    "menstrual_disorder"
]
For more details about the structure of the case_data in the CaseTemplates table, see Section 3.2.2 CaseTemplates.
Data Flow
When a user selects a cardinal symptom on the landing page, Clinic Edge:
- Searches all cases within the
CaseTemplatestable that are associated with this cardinal symptom - Randomly selects one case
- Generates a realistic patient case using predefined parameters and probabilistic variation
The flow diagram below shows how the CardinalSymptoms table is connected to the case data:
The graph below shows how cardinal symptoms can be mapped to multiple cases: